Analytics & Reports
Two surfaces cover your numbers: Analytics for business performance at a glance (visible to everyone), and Reports for detailed financial reporting (admins and managers). Both consolidate revenue into a single reporting currency.
Analytics
Open Analytics in the sidebar (Home group) and pick a time range: Last 7, 30, or 90 Days, or Last Year. Key things to know about the numbers:
- One Reporting Currency — Revenue is converted using historical exchange rates. An amber provenance banner explains any trips converted at today’s rate or excluded because a rate was missing
- Booked Revenue — Only confirmed and completed trips count
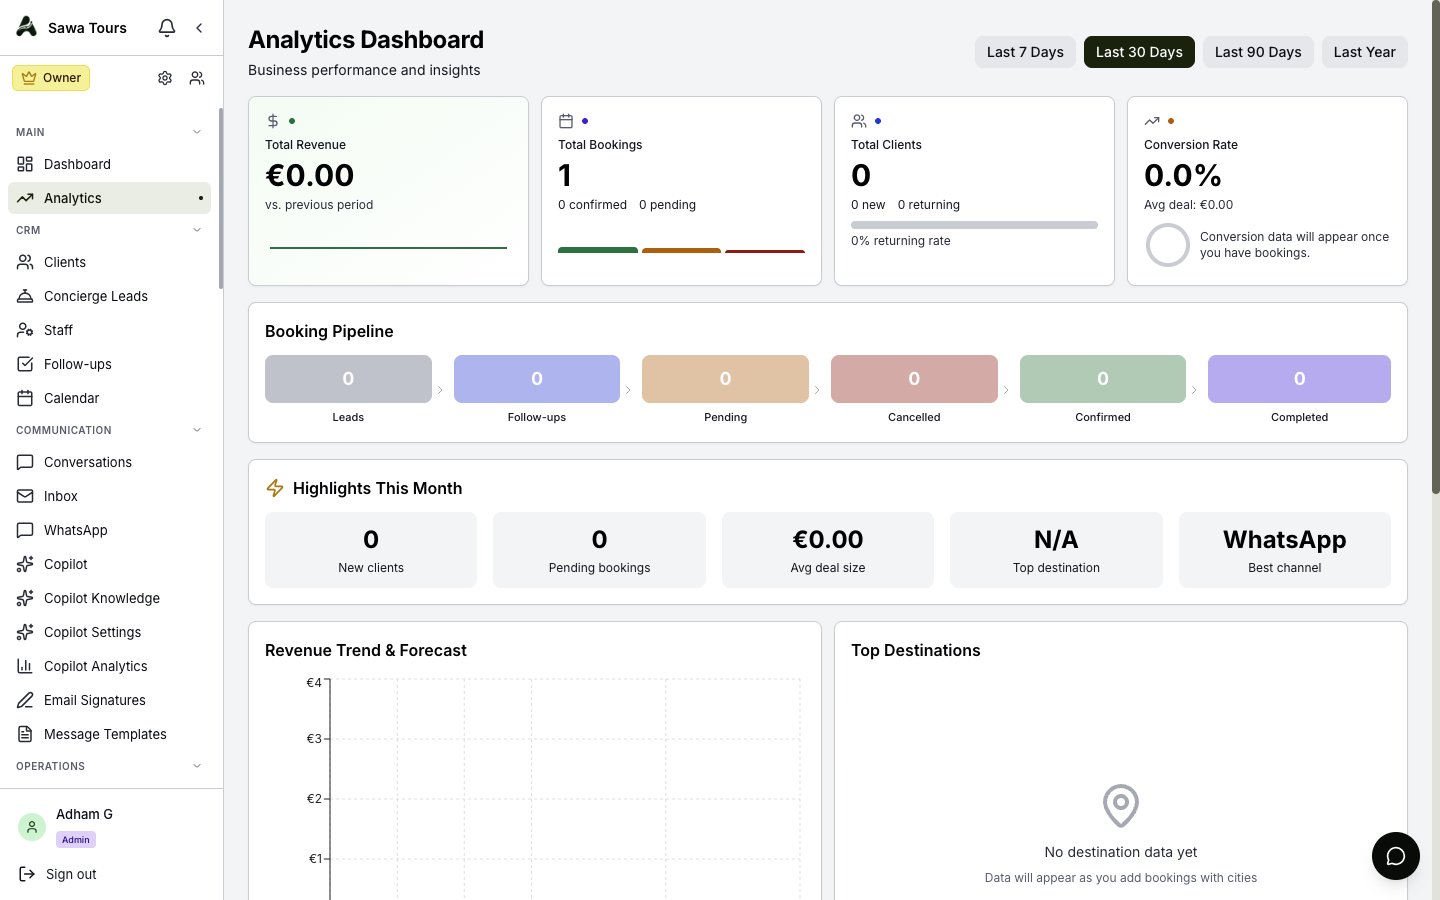
Analytics page top: time range selector and the four KPI cards (Total Revenue, Total Bookings, Total Clients, Conversion Rate) with sparklines
What’s on the Analytics Page
- KPI Cards with Sparklines — Total Revenue (with growth vs the previous period), Total Bookings (confirmed/pending split), Total Clients, and Conversion Rate
- Revenue Forecast — A next-period projection with a confidence percentage and trend, computed by a regression over your weekly revenue
- Booking Pipeline — Where your bookings sit right now
- Highlights This Month — New clients, pending bookings, average deal size, top destination, and best channel
- Revenue Trend & Forecast — Revenue over time with the projection
- Top Destinations — With a dropdown filter
- Booking Status and Revenue by Destination — Distribution panels
- Quick Actions — A grid of shortcuts to common tasks
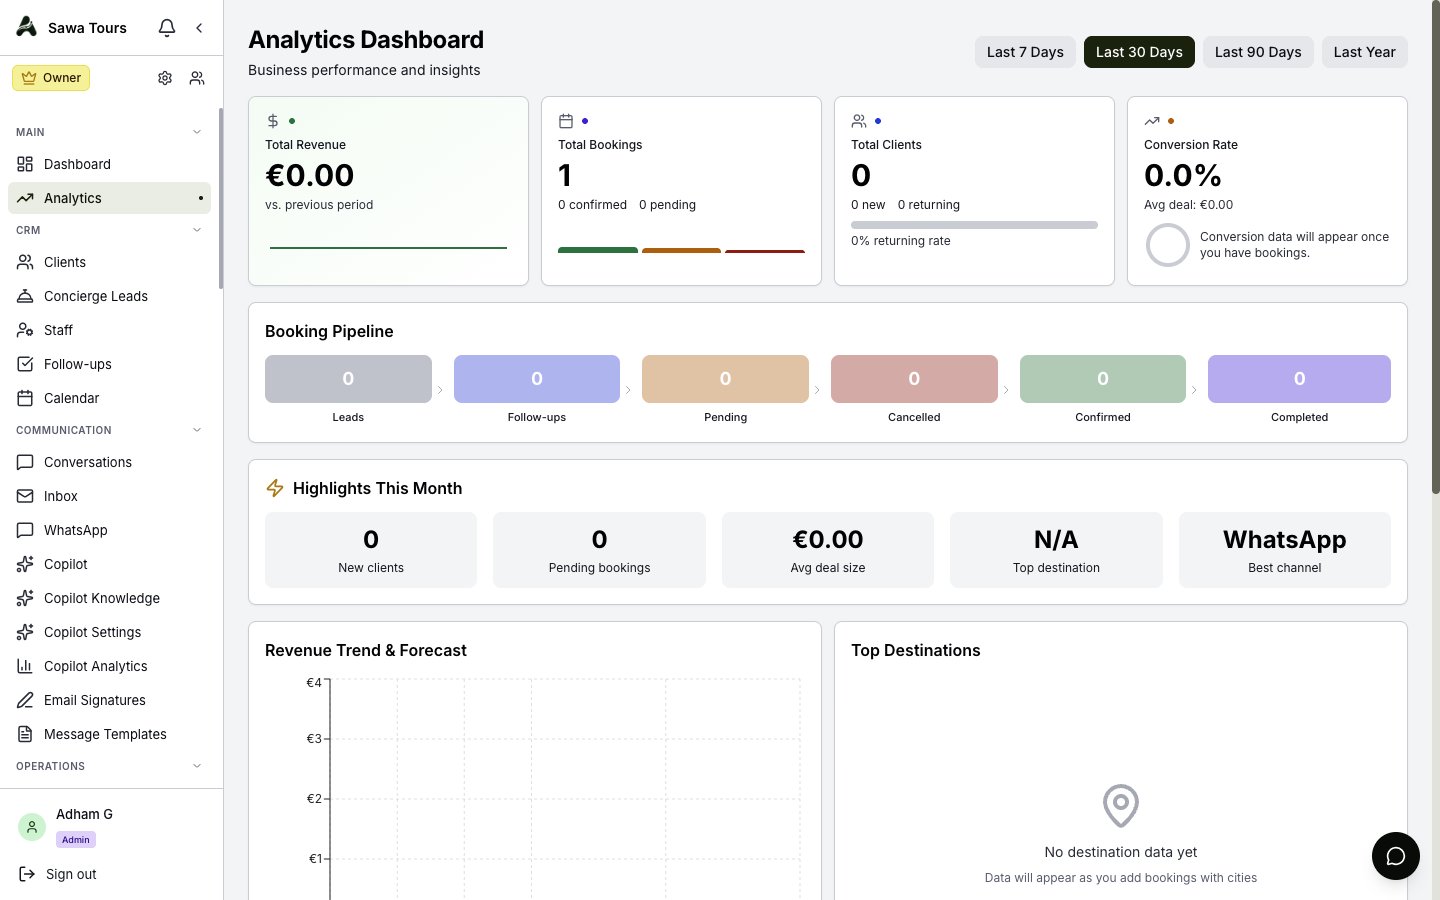
Analytics page scrolled to the Revenue Forecast card with confidence %, Booking Pipeline, Highlights This Month, and the Revenue Trend & Forecast chart
Financial Reports
Open Reports in the sidebar (Home group; admins and managers only). The page is headed Financial Reports, with a year selector and five tabs:
- Overview — Summary cards including profit margin, collection rate, and average trip value, plus Quarterly Performance and Monthly Revenue vs Expenses
- Revenue — A monthly revenue table
- Cash Flow — Inflows, Outflows, Net, Pending Receivables, Pending Payables, and Projected Cash, with a monthly table
- Tax Summary — Taxable income, a VAT summary estimated at 14%, and an expense breakdown by category
- Commissions — Totals, breakdown by type, and a per-recipient table
Every table exports to CSV, and the same FX provenance banner from Analytics appears here so you always know how currencies were converted.
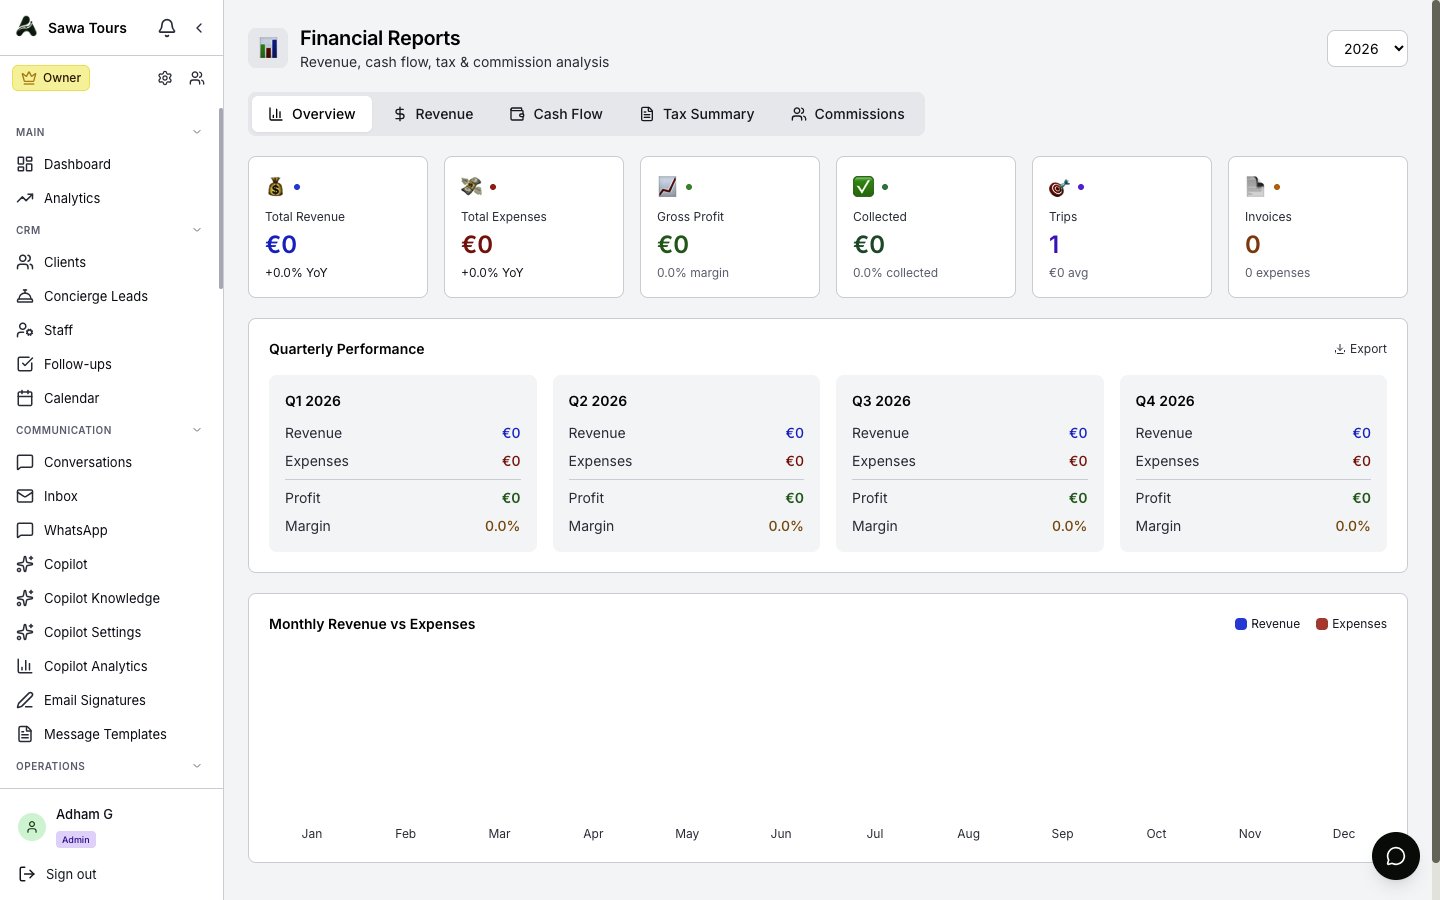
Financial Reports page with year selector and the five tabs, Overview tab active showing summary cards and Quarterly Performance
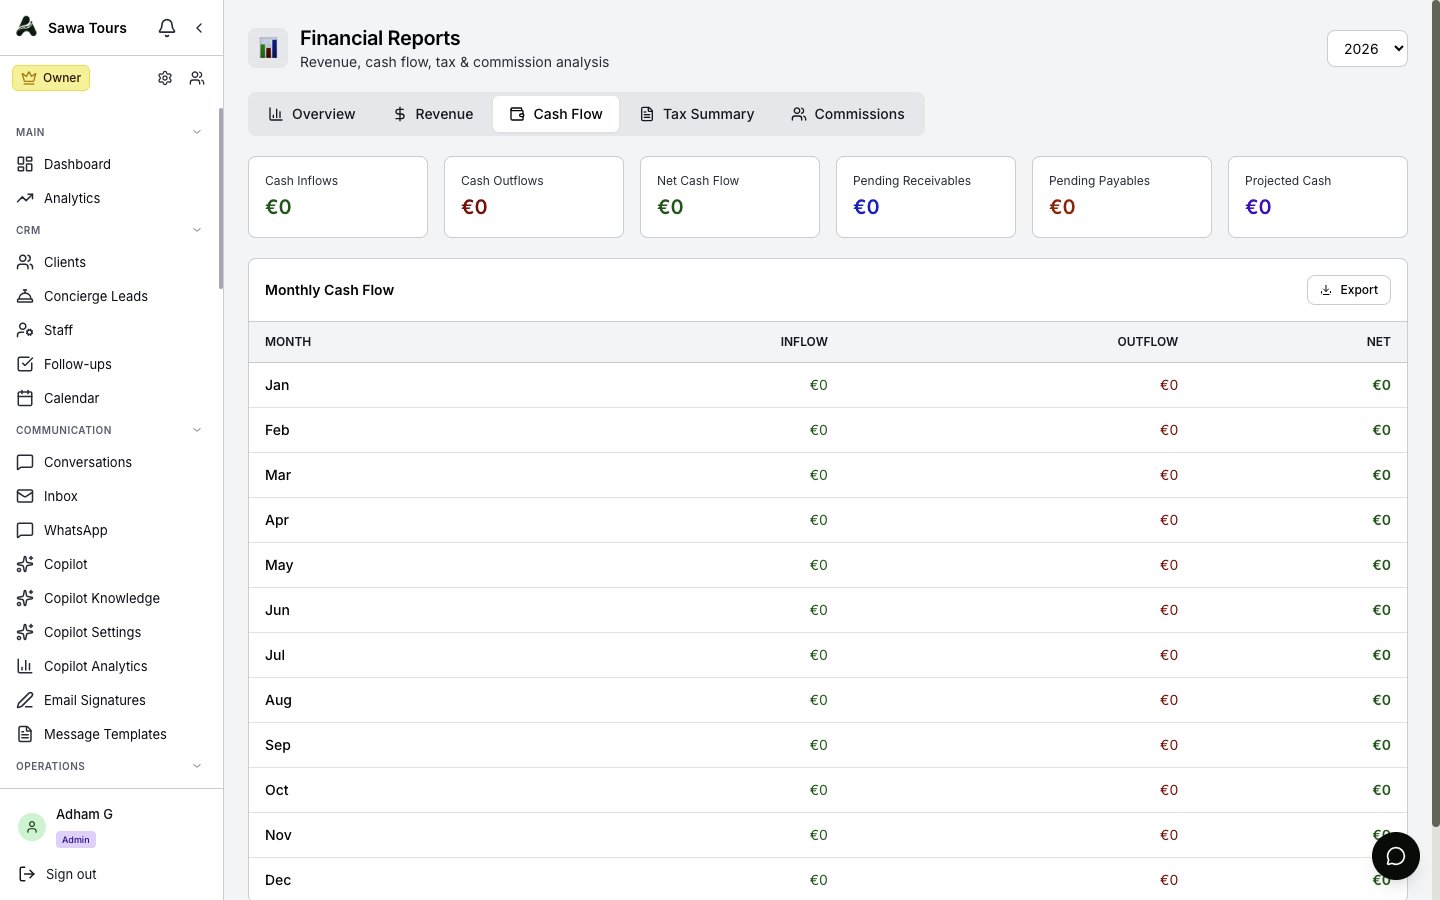
Financial Reports Cash Flow tab showing Inflows, Outflows, Net, Pending Receivables, Pending Payables, Projected Cash, and the monthly table